Calling Balls & Strikes in Nassau County
Former Nassau County Comptroller Jack Schnirman may have referred to his office as “the fiscal umpire for the county,” but the work of a comptroller comes down to more than calling balls and strikes. It’s about building partnerships, sharing information and ideas, and continuing the mission of making government better. Starting in 2018, Schnirman and his team put a plan into place to increase transparency and improve data use in the comptroller’s office.
Calling Balls and Strikes
Schnirman took office in 2018 with an aggressive plan to overhaul how the county managed its financial records with an end goal to modernize and open up the books. For decades, the county relied on “an obsolete patchwork of computer systems” to manage its $3 billion budget as well as payroll for 14,000 employees working for the county and Nassau Community College.
“The financial system was 1990s software that looked like a video game from the early 1980s built with 1960s technology,” Schnirman said. “Bottom line is you’re playing pong.”
With county staffing at an all-time low, the team faced a critical duty to “do more with less.” They needed a simple way to access and share data with stakeholders, which included 1.4 million residents. However, the system was at the root of several challenges, among them, the sheer volume of time to access information.
Data analysts were spending up to two hours a day manually producing reports with information on contracts, departments, vendors, amounts, and effective dates. Schnirman knew there had to be a better way to maximize their time.
“We needed to gather the data, make sense of it, make it publicly accessible, and create the kind of access the public needs and deserves — knowing most people are capable of looking up their own finances and spending analysis on their cell phones,” Schnirman said. “Why couldn’t we do that same thing for our county?”
A Data Platform for Transparent Analytics
Schnirman saw data as a strategic asset that could improve resource allocation, increase operational efficiencies, and drive economic development. He wanted a turnkey solution to modernize the county’s underlying financial system with transparency at its core.


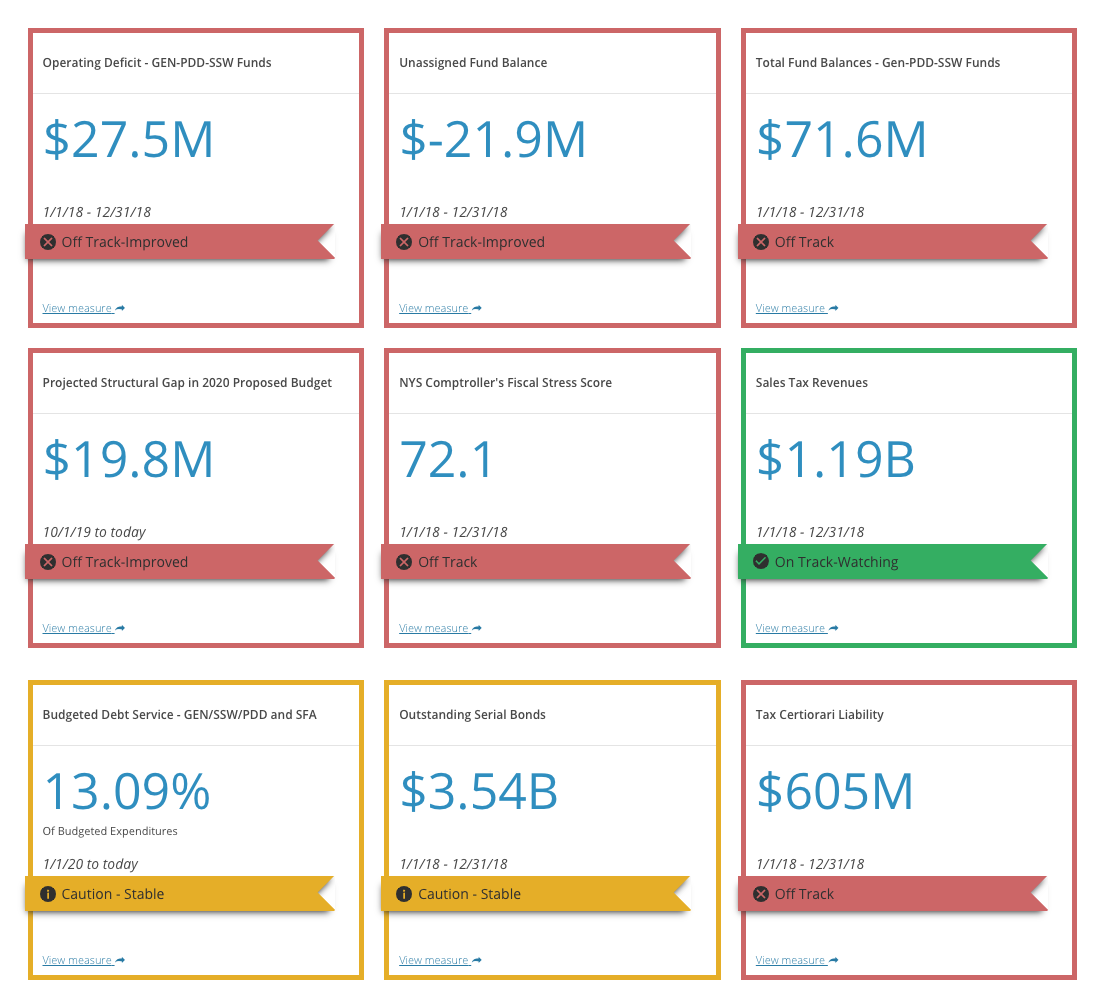
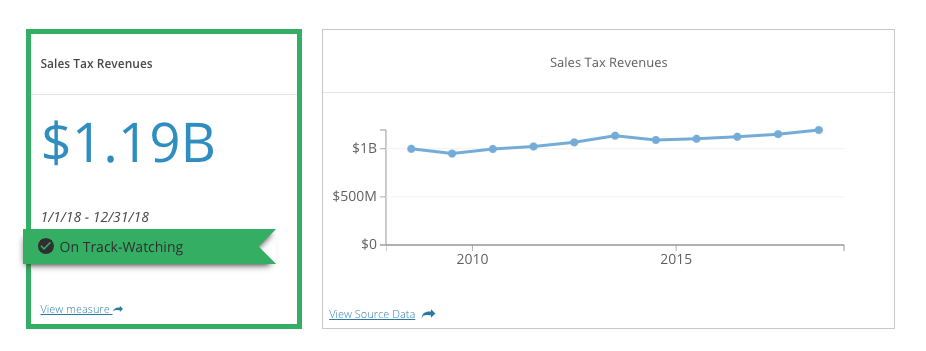
The Nassau County Comptroller’s Scorecard gives an in-depth look at key indicators of the county’s fiscal health including details on what the indicator is, why it matters, and easy-to-understand context of where the county stands.
You can look at one dashboard of key numbers and see what’s heading in the right direction and what can be improved. It uses real, critical data in a way to determine and understand where the county stands financially.
Jack Schnirman
former Nassau County Comptroller
Convinced by Tyler Technologies’ proof of concept, Schnirman selected Tyler’s Enterprise Data Platform, an enterprise internal data-sharing platform, as their tool of choice. County Executive Laura Curran and her administration played a crucial role in launching the data platform to push forward and foster more transparency and accountability.
“When I ran for office, I knew it was very important to deliver on the promise of transparency, making sure that it was up to us now to win back the trust of the people,” Curran said in an interview with Government Technology. “The trust really was frayed. You can talk about transparency and accountability, but you have to do concrete things to show people you’re serious about this.”
To some degree, bolstering transparency hinged on shifting from storing documents, such as financial disclosure forms, in reams of paper filed in cardboard boxes stacked in a county basement versus storing this information in a usable, machine-readable format accessible within a click of a button. Using the Enterprise Data Platform, the team sought to implement a platform to centralize and codify the county’s data so that line-of-business users can quickly and easily access data.
Tyler’s Enterprise Data Platform gives key stakeholders the ability to drill into specific agencies to understand departmental budget allocation and spending trends, and they could, for the first time, develop data stories to add background and context to otherwise complex financial topics. With robust internal security and permissions capabilities, the county can share data knowing the right people are able to access the right data.
The team also leveraged Data & Insights’ public-facing apps to develop a financial transparency program providing the public and internal staff with insights into the county’s budget, payroll, and expenditures.
For example, Open Budget focuses on the county’s $3.8 billion operating revenues and expenditures. Revenues are broken down by major funding source — sales and property taxes, for example — while operating expenditures are broken down from the department level to individual budgetary line items.
Open Payroll gives insights into the county’s payroll expenditures by department and employee. It shows the county’s various pay types, and this site gives the county control over how the data is presented and the frequency at which it is published.
While the county initially focused on making finance-related data more transparent, they’re using the Enterprise Data Platform to re-establish a performance management program to improve the way they do business. The county is also developing a centralized data sharing program and a data leadership governance committee to help in that effort. The county launched a financial scorecard and is using the data platform to generate recommendations to improve financial operations and cost efficiencies.
“What we set out to do with the scorecards was create one dashboard that would encapsulate the key metrics,” Schnirman said. “You can look at one dashboard of key numbers and see what’s heading in the right direction and what can be improved. It uses real, critical data in a way to determine and understand where the county stands financially.”
The Right Tools for the Right Job
Deploying Tyler’s Data & Insights solution in Nassau County was a successful step that is powering positive results.
“Everything takes training,” Schnirman said. “From an enterprise perspective, I was very impressed having been through a variety of software implementations with how quick the process was, how easy the ramp up was, and how collaborative and teamoriented it was.”
It would take about two hours of an analyst’s time to run the report, and now they do it in a number of seconds. This saved them hours of work every day with a quick refresh on Socrata.
Jonathan Cavalieri
Director of Research and Innovation
Tyler’s data platform is an integral part of the functions of the comptroller’s office and powers 32 open datasets, which contribute to nine data stories, three maps, 24 charts, and more. The county experienced a cultural shift where the approach to decisions, fact-finding, and daily work became more data-centric and data-driven.
“It’s a helpful vehicle for our policy and research team to put information out in a nice, easily accessible format for the public,” Schnirman said. “We’re using stories now for policy and research reports, we created a resiliency tracker, we’re putting a different take on it.”
The county even published, for the first time, an interactive Popular Annual Financial Report using Perspectives, a Data & Insights tool that provides context and stories around the data.
“We have audiences of our analysts, public employees, engaged users around the county and the public at-large,” Schnirman said. “Our hope is to create content that doesn’t sit on a shelf, but is more dynamic, evocative, and relatable.”
From Fiscal Friction to Financial Focus
The way to measure success is not just in the feedback that organizations receive or in the public trust that’s restored. By creating understanding and buy-in with financial transparency, governments can create a more fact-based discussion in their ecosystems.
“One of the things the Enterprise Data Platform has been helpful with is changing the culture,” Schnirman said. “It’s creating a more data-driven culture and we’re starting to see the results of it. Discussions are becoming more fact-based. It’s no longer just the story they want to tell, it’s the story illustrated by facts.”
As for the hours employees were spending creating daily reports, such as the Outstanding Claims Report, Jonathan Cavalieri, director of research and innovation at the county, said the process now takes seconds.
“We held trainings for the accounting division to show them the online checkbook and how they can use it day to day for claims with a new tracking tool,” Cavalieri said. “It would take about two hours of an analyst’s time to run the report, and now they do it in a number of seconds. This saved them hours of work every day with a quick refresh on the data platform.”
Creation of this report is estimated to save more than 250 hours of productivity annually. The estimate is based on one employee’s workload and the true number may be higher or lower.